January data signals optimism in 2024 for Austin area

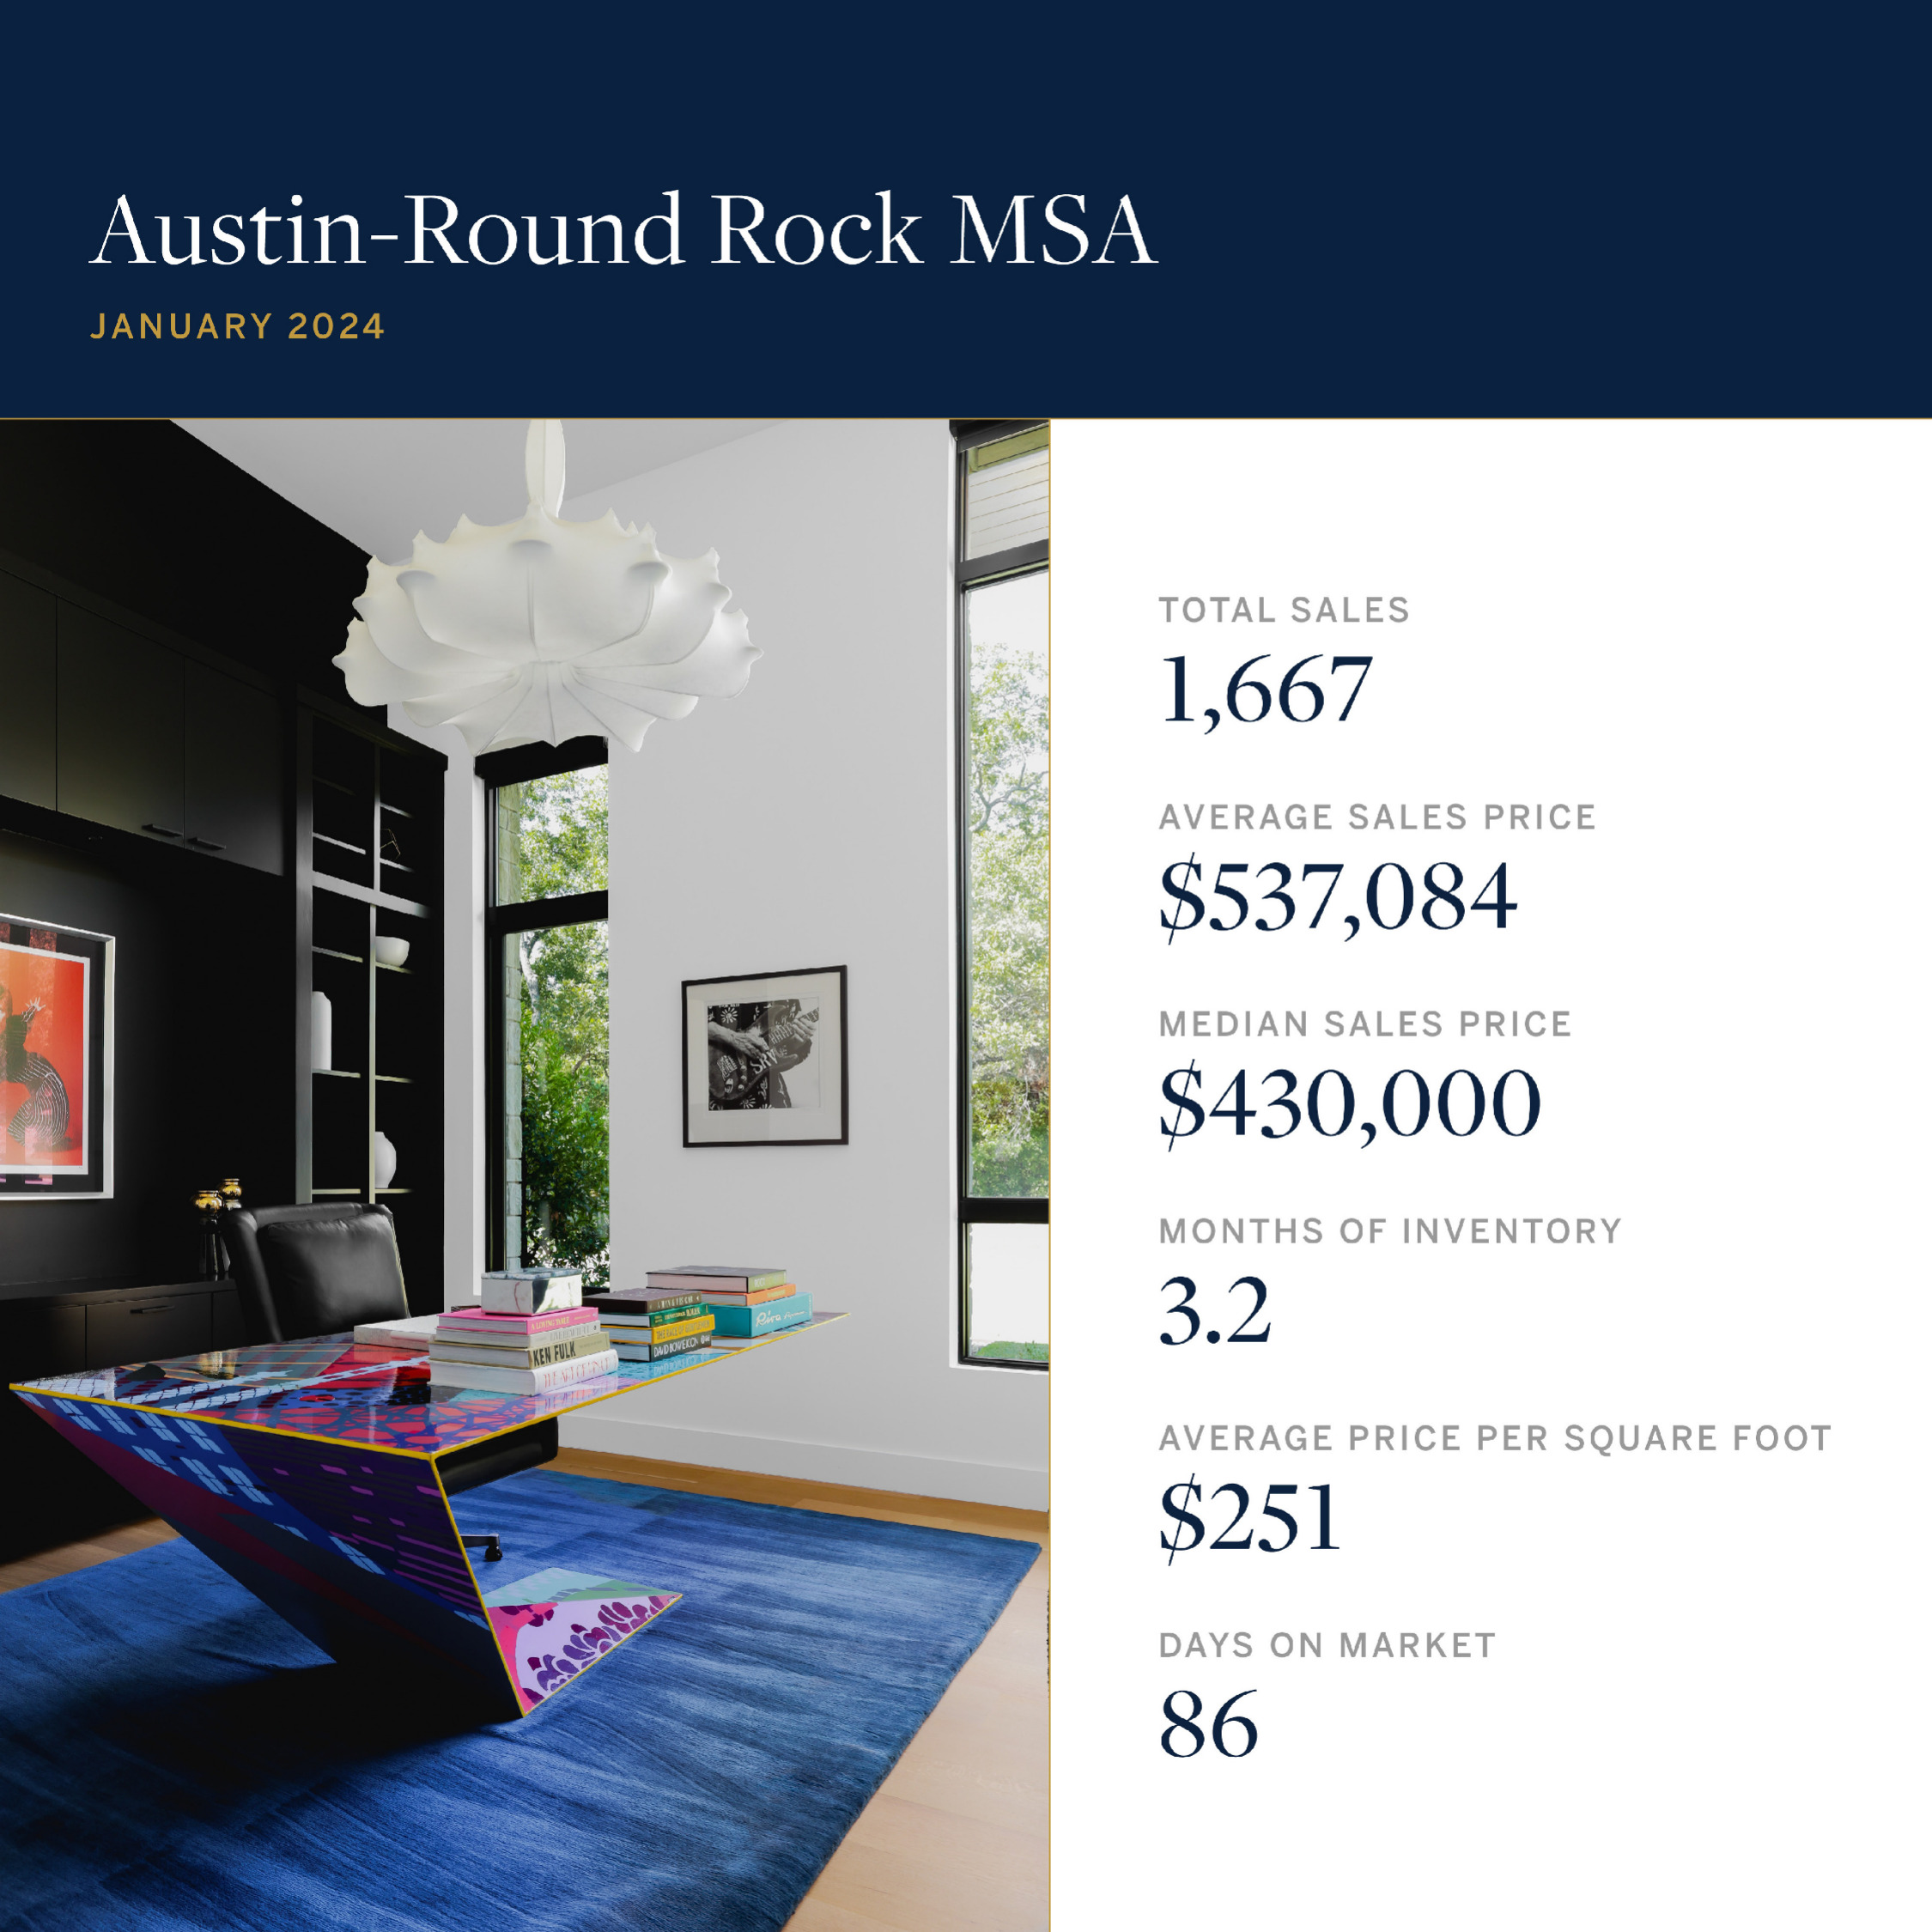
Austin, Texas -- The first market analysis of the year released by Unlock MLS shows an increase in residential homes sold, up 4.3% to 1,667 closed sales, and an uptick in pending sales, which rose 3.8% to 2,480 listings, according to the latest Central Texas Housing Market Report. The data demonstrates that more options are available for potential homebuyers and sellers are feeling optimistic moving into 2024.
Clare Losey, Ph.D., housing economist for Unlock MLS and the Austin Board of REALTORS®, noted that although still elevated, the recent decline in mortgage rates is contributing to lower home prices and the increase in closed sales activity.
“January marks the fifteenth consecutive month of year-over-year median sales price declines in the Austin Round Rock housing market, empowering more homebuyers to enter our market. Mortgage rates peaked in late October before declining in November and December, providing a boost to buyer’s purchasing power, which is borne out in the increase in residential homes sold in January. While there are more options available for homebuyers in our market today, more work needs to be done to ensure more affordable housing is available in Central Texas. ABoR will continue to work to champion housing policies aimed at assisting those who need it the most and collaborate with Austin City Council.”
Kent Redding, 2024 Unlock MLS and ABoR president, provided some background on how the organization analyzes housing data using Unlock MLS.
“Unlock MLS provides REALTORS® with the most comprehensive and up-to-date listing data in Central Texas,” Kent Redding, 2024 Unlock MLS and ABoR president, said. “Our commitment lies in fostering a dependable and transparent marketplace, providing Central Texans access to the industry’s most accurate housing data. We look forward to providing a timelier monthly glimpse and analysis of the Austin-area housing market.”


Austin Round-Rock MSA
1,667 – Residential homes sold, 4.3% more than January 2023.
$430,000 – Median price for residential homes, 4.4% less than January 2023.
3,064– New home listings on the market, 5.1% more than January 2023.
7,976– Active home listings on the market, 3.6% less than January 2023.
2,480 – Pending sales, 3.8% more than January 2023.
3.2 – Months of inventory, 0.2 months more than January 2023.
$892,581,695– Total dollar volume of homes sold, 0.1% less than January 2023.
City of Austin
520 – Residential homes sold, 0.6% less than January 2023.
$534,500 – Median price for residential homes, 2.8% less than January 2023.
979 – New home listings on the market, 4.8% less than January 2023.
2,691 – Active home listings on the market, 7.7% more than January 2023.
788 – Pending sales, 0.6% more than January 2023.
3.2 – Months of inventory, 0.7 months more than January 2023.
$348,321,203– Total dollar volume of homes sold, 7.3% less than January 2023.
Travis County
712 – Residential homes sold, 4.9% less than January 2023.
$478,500– Median price for residential homes, 3.3% less than January 2023.
1,398– New home listings on the market, 1.1% less than January 2023.
3,819 – Active home listings on the market, 4.3% more than January 2023.
1,043 – Pending sales, 4.0% less than January 2023.
3.4 – Months of inventory, 0.6 months more than January 2023.
$447,677,093 – Total dollar volume of homes sold, 7.8% less than January 2023.
Williamson County
607 – Residential homes sold, 9.6% more than January 2023.
$429,000 – Median price for residential homes, 2.5% less than January 2023.
992 – New home listings on the market, 9.5% more than January 2023.
2,307 – Active home listings on the market, 16.8% less than January 2023.
897 – Pending sales, 4.5% more than January 2023.
2.6 – Months of inventory, 0.3 months less than January 2023.
$287,126,634 – Total dollar volume of homes sold, 6.7% more than January 2023.
Hays County
251 – Residential homes sold, 4.6% more than January 2023.
$366,140 – Median price for residential homes, 11.8% less than January 2023.
450 – New home listings on the market, 8.4% more than January 2023.
1,281 – Active home listings on the market, 0.4% less than January 2023.
383 – Pending sales, 10.7% more than January 2023.
3.7 – Months of inventory, 0.1 months more than January 2023.
$117,387,841– Total dollar volume of homes sold, 0.6% more than January 2023.
Bastrop County
81 – Residential homes sold, 58.8% more than January 2023.
$366,018 – Median price for residential homes, 4.6% more than January 2023.
183 – New home listings on the market, 33.6% more than January 2023.
454 – Active home listings on the market, 3.8% less than January 2023.
118 – Pending sales, 45.7% more than January 2023.
4.5 – Months of inventory, 0.2 months less than January 2023 and the highest inventory in the MSA.
$32,822,238– Total dollar volume of homes sold, 60.8% more than January 2023.
Caldwell County
16 – Residential homes sold, 220.0% more than January 2023.
$303,990– Median price for residential homes, 9.3% less than January 2023.
41 – New home listings on the market, 6.8% less than January 2023.
115 – Active home listings on the market, 36.9% more than January 2023.
39 – Pending sales, 105.3% more than January 2023.
3.7 – Months of inventory, 0.2 months more than January 2023.
$7,567,890– Total dollar volume of homes sold, 363.3% more than January 2023.
Have questions or want to know how this will effect the buying or selling of your property? If so, please don't hesitate to reach out to us. Give us a call or use the form below. We hope to hear from you soon!


