Surge in Housing Inventory Defines First Half of 2024 in the Austin Area

According to the June and Mid-Year 2024 Central Texas Housing Report released by Unlock MLS, active home listings in June increased 25.9% to 13,227 listings. This increase, coupled with the rise in mortgage rates in late April and early May to 7.2%, induced a decline of 6.3% to the median sales price of $450,000 in June, providing buyers with the highest level of inventory, 5.0 months of inventory, in the MSA since 2011.
Clare Knapp, Ph.D., housing economist for Unlock MLS and the Austin Board of REALTORS®, pointed to buyer and seller tendencies and their effect on the market.
“In June, and the first half of the year, we’ve seen sellers remain resolute in their price point, a main factor behind the decline in sales of 13.4%. For buyers, the recent surge in active listings, plus affordability constraints for moderate-income buyers, means that they are choosing to be more selective when purchasing a home. The market will continue to find its footing in the latter half of the year, proving that both buyers and sellers will need to remain nimble and work closely with their REALTOR® to find and negotiate their best option.”
Kent Redding, 2024 ABoR and Unlock MLS president, stressed key actions to be successful in today’s market.
“For the remainder of the year, both buyers and sellers need to adjust the way they navigate the market. Homes are selling at 96.4% of original list price, but the homes that are selling are moving because they are showing well and priced appropriately. Price and presentation are the top two critical components to a successful sale, whereas time on the market can be a big detractor. For buyers, now is the time to expand your options and make competitive offers in this high-inventory environment. Ensure your REALTOR® is in lockstep with your motivations and goals so that you can confidently make bold decisions that maximize the opportunity present in the market.”


Austin-Round Rock-San Marcos MSA: June 2024
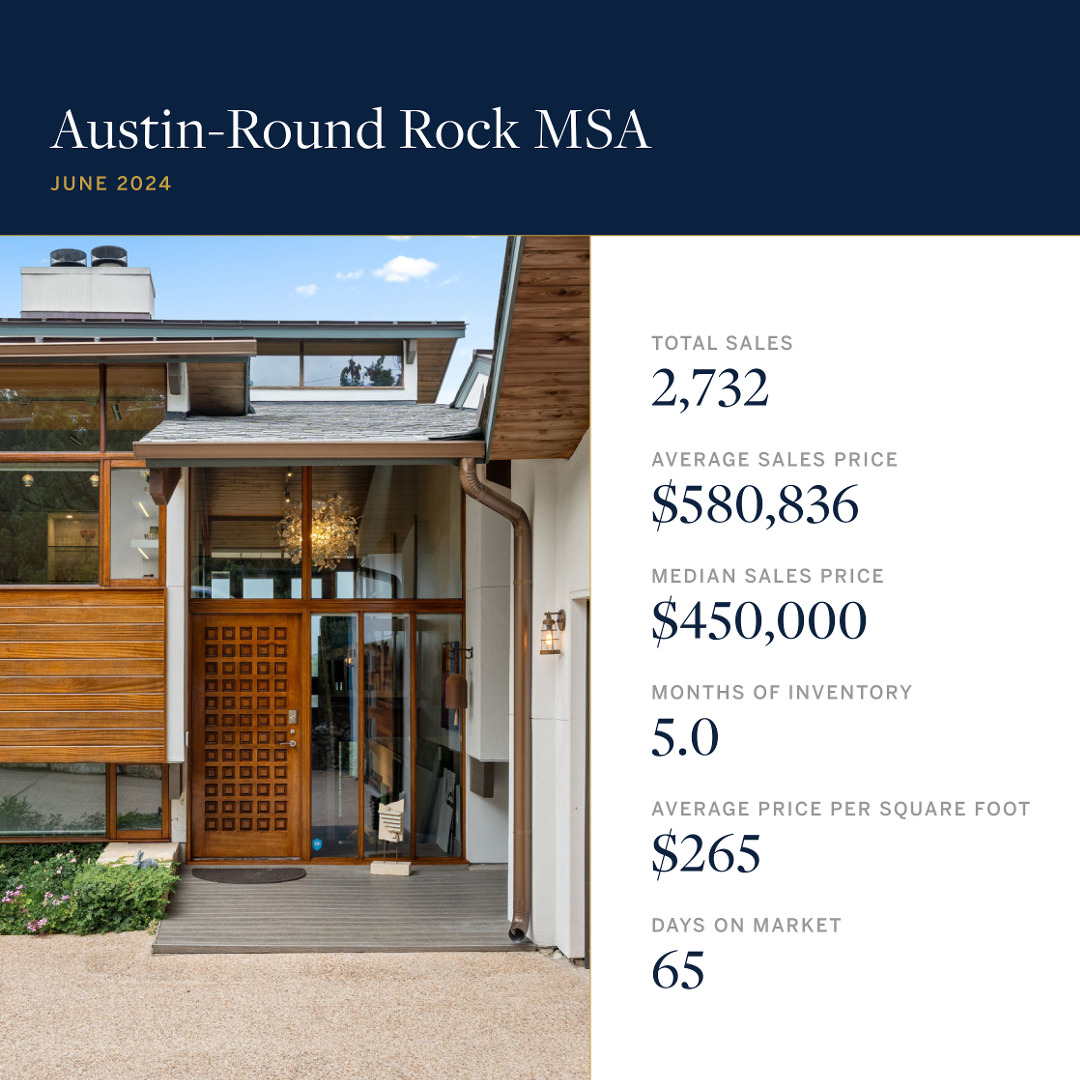
2,732 – Residential homes sold, 13.4% less than June 2023.
$450,000 – Median price for residential homes, 6.3% less than June 2023.
4,364 – New home listings on the market, 3.9% less than June 2023.
13,227 – Active home listings on the market, 25.9% more than June 2023.
2,802 – Pending sales, 2.4% less than June 2023.
5.0 – Months of inventory, 1.3 months more than June 2023.
$1,581,439,443 – Total dollar volume of homes sold, 18.0% less than June 2023.
96.40% – Average close to list price, compared to 94.7% in June 2023.
Austin-Round Rock-San Marcos MSA: Year to Date
15,189 – Residential homes sold, 1.8% less than the first half of 2023.
$450,000 – Median price for residential homes, 2.2% less than the first half of 2023.
26,398 – New home listings on the market, 15.4% more than the first half of 2023.
63,005 – Active home listings on the market, 15.5% more than the first half of 2023.
16,676 – Pending sales, 1.6% more than the first half of 2023.
$8,780,135,436 – Total dollar volume of homes sold, 2.7% less than the first half of 2023.
City of Austin: June 2024
868 – Residential homes sold, 21.0% less than June 2023.
$600,000 – Median price for residential homes, 1.6% less than June 2023.
1,661 – New home listings on the market, 10.0% less than June 2023.
5,632 – Active home listings on the market, 43.4% more than June 2023.
910 – Pending sales, 12.2% less than June 2023.
5.8 – Months of inventory, 1.9 months more than June 2023.
$665,437,038 – Total dollar volume of homes sold, 23.6% less than June 2023.
95.2% – Average close to list price, compared to 95.48% in June 2023.
City of Austin: Year to Date
5,172 – Residential homes sold, 2.9% less than the first half of 2023.
$574,995– Median price for residential homes, flat compared to the first half of 2023.
9,987 – New home listings on the market, 11.5% more than the first half of 2023.
23,289 – Active home listings on the market, 24.9% more than the first half of 2023.
5,636 – Pending sales, 1.7% less than the first half of 2023.
$3,895,461,068 – Total dollar volume of homes sold, 3.3% less than the first half of 2023.
Travis County: June 2024
1,210 – Residential homes sold, 18.6% less than June 2023.
$525,000 – Median price for residential homes, 3.7% less than June 2023.
2,122 – New home listings on the market, 9.9% less than June 2023.
6,819 – Active home listings on the market, 29.9% more than June 2023.
1,224 – Pending sales, 9.4% less than June 2023.
5.8 – Months of inventory, 1.8 months more than June 2023.
$842,700,113 – Total dollar volume of homes sold, 21.9% less than June 2023.
97.2% – Average close to list price, compared to 94.9% in June 2023.
Travis County: Year to Date
6,830 – Residential homes sold, 4.8% less than the first half of 2023.
$520,000 – Median price for residential homes, 0.1% more than the first half of 2023.
12,981 – New home listings on the market, 11.2% more than the first half of 2023.
31,533 – Active home listings on the market, 21.4% more than the first half of 2023.
7,453 – Pending sales, 2.6% less than the first half of 2023.
$4,779,938,098 – Total dollar volume of homes sold, 4.0% less than the first half of 2023.
Williamson County: June 2024
945 – Residential homes sold, 15.1% less than June 2023.
$434,000 – Median price for residential homes, 3.6% less than June 2023.
1,357 – New home listings on the market, 2.0% less than June 2023.
3,727 – Active home listings on the market, 23.0% more than June 2023.
976 – Pending sales, 1.3% less than June 2023.
4.1 – Months of inventory, 1.1 months more than June 2023.
$472,989,836 – Total dollar volume of homes sold, 17.8% less than June 2023.
95.7% – Average close to list price, compared to 94.51% in June 2023.
Williamson County: Year to Date
5,254 – Residential homes sold, 3.9% less than the first half of 2023.
$430,000 – Median price for residential homes, 1.6% less than the first half of 2023.
8,051 – New home listings on the market, 14.8% more than the first half of 2023.
17,613 – Active home listings on the market, 5.7% more than the first half of 2023.
5,746 – Pending sales, 0.2% more than the first half of 2023.
$2,555,608,499 – Total dollar volume of homes sold, 5.7% less than the first half of 2023.
Hays County: June 2024
413 – Residential homes sold, 1.7% more than June 2023.
$391,775 – Median price for residential homes, 7.8% less than June 2023.
623 – New home listings on the market, 5.4% more than June 2023.
1,908 – Active home listings on the market, 20.4% more than June 2023.
416 – Pending sales, 6.9% more than June 2023.
4.9 – Months of inventory, 0.7 months more than June 2023.
$205,309,071 – Total dollar volume of homes sold, 3.7% less than June 2023.
95.8% – Average close to list price, compared to 94.0% in June 2023.
Hays County: Year to Date
2,202 – Residential homes sold, 5.7% more than the first half of 2023.
$385,000 – Median price for residential homes, 3.8% less than the first half of 2023.
3,783 – New home listings on the market, 28.1% more than the first half of 2023.
9,703 – Active home listings on the market, 16.2% more than the first half of 2023.
2,471 – Pending sales, 12.1% more than the first half of 2023.
$1,092,777,071 – Total dollar volume of homes sold, 5.8% more than the first half of 2023.
Bastrop County: June 2024
111 – Residential homes sold, 1.5% more than June 2023.
$339,450 – Median price for residential homes, 10.7% less than June 2023.
198 – New home listings on the market, 26.9% more than June 2023.
633 – Active home listings on the market, 23.9% more than June 2023.
140 – Pending sales, 29.6% more than June 2023.
5.7 – Months of inventory, 1.1 more than June 2023.
$42,857,579 – Total dollar volume of homes sold, 10.7% less than June 2023.
94.7% – Average close to list price, compared to 93.6% in June 2023.
Bastrop County: Year to Date
661 – Residential homes sold, 12.0% more than the first half of 2023.
$360,000 – Median price for residential homes, 5.2% less than the first half of 2023.
1,206 – New home listings on the market, 29.8% more than the first half of 2023.
3,295 – Active home listings on the market, 12.4% more than the first half of 2023.
717 – Pending sales, 12.2% more than the first half of 2023.
$268,529,211 – Total dollar volume of homes sold, 8.6% more than the first half of 2023.
Caldwell County: June 2024
57 – Residential homes sold, 45.0% more than June 2023.
$300,000 – Median price for residential homes, 7.1% more than June 2023.
61 – New home listings on the market, 8.9% more than June 2023.
138 – Active home listings on the market, 8.1% more than June 2023.
44 – Pending sales, 25.7% more than June 2023.
3.0 – Months of inventory, 0.3 months less than June 2023.
$18,869,166 – Total dollar volume of homes sold, 42.2% more than June 2023.
95.9% – Average close to list price, compared to 97.9% in June 2023.
Caldwell County: Year to Date
242 – Residential homes sold, 60.3% more than the first half of 2023.
$299,945 – Median price for residential homes, flat compared to the first half of 2023.
377 – New home listings on the market, 23.6% more than the first half of 2023.
861 – Active home listings on the market, 36.2% more than the first half of 2023.
289 – Pending sales, 54.5% more than the first half of 2023.
$83,282,558 – Total dollar volume of homes sold, 58.4% more than the first half of 2023.
For more information or to download the June and Mid-Year 2024 Central Texas Housing Report, visit ABoR.com/MarketStatistics.
Have questions or want to know how this will effect the buying or selling of your property? If so, please don't hesitate to reach out to us. Give us a call or use the form below. We hope to hear from you soon!


